


- Best Udacity Python Courses - January 31, 2022
- Sites Like Udacity: Alternatives & Competitors - January 23, 2022
- Udacity Course Platform Review - January 23, 2022
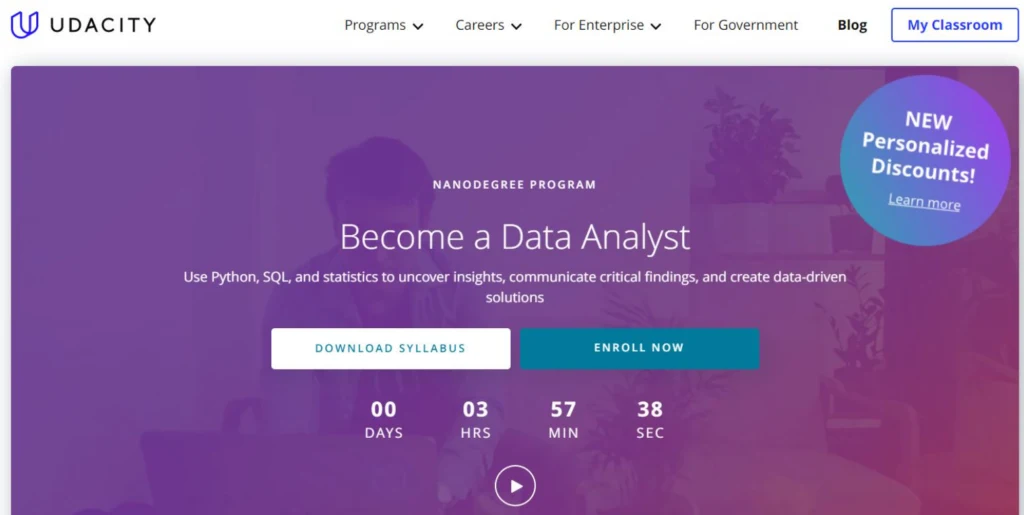
Becoming a Data Analyst couldn’t be any easier when you gain a degree with Udacity. Data Analysts use Python, SQL, and statistics to decipher insightful information, discover critical problems, and create data-driven answers and solutions.
To identify and analyze data results, you need to become knowledgeable about computer tech skills to help you learn to organize data information, uncover patterns and insights, come to meaningful conclusions, and be able to communicate those critical findings and suggest solutions
Knowing Python and its data analysis library (NumPy, pandas, Matplotlib) and SQL will be an invaluable tool for your success in Data Analyst.
It would be recommended that students have access and knowledge to Python (NumPy and Panda) and SQL before signing up for the Nanodegree Data Analyst program. Later in this article, I give you more information on prerequisites should you need to consider this before signing up for the Data Analyst Program.
Data Analysis with Python and SQL

With this program, you will take Python and SQL to refine complex data, learn to read, arrange and prepare data for analysis, and prepare the data to communicate and present to management.
Data Analyst Program – Who is this for?
For those who want to master Python and statistics skills that qualify you for high-value jobs in the data field by businesses of all sizes.
Prerequisite Knowledge
Before signing up for Data Analyst, you should have experience working with Python (NumPy and Pandas) and SQL.
Fortunately, Udacity has a Python & SQL course. However, they are Nanodegree so it is not free and they will put you back about 2-months for each course before you can proceed with the Data Analyst course.
Nanodegree – Python “Learn Intermediate Python”

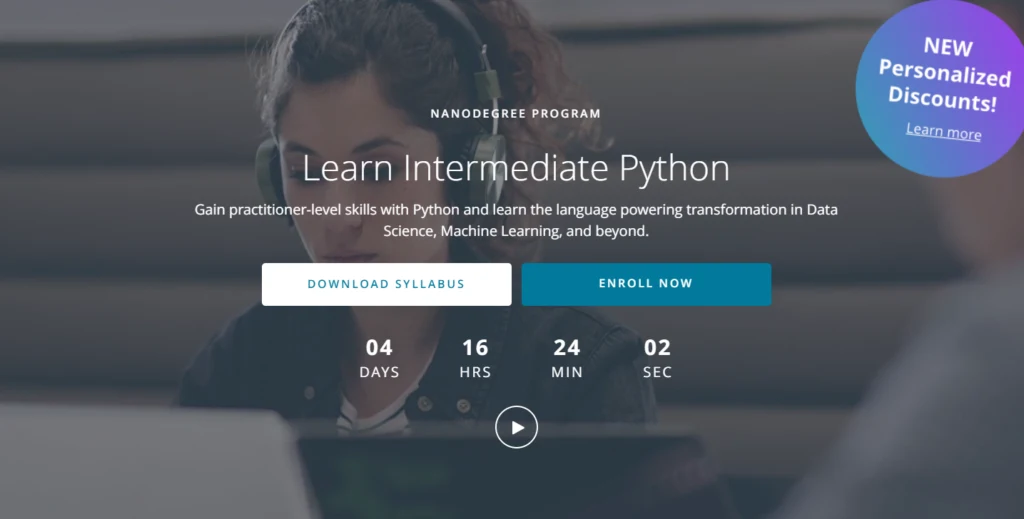
For those that are not clear what Python is, it is a coding language that has applications in Web development, data science, machine learning, and more. This program teaches capability skills to streamline the function of Python to perform complex tasks, like classifying files, data mining a webpage, and more with hands-on activities.
Prerequisites and Requirements for Python
Students need to understand the basics of object-oriented programming, read basic Python syntax, use white space, distinguish between object types, write and run basic programming scripts in a terminal including function definitions and loops.
It is 2-months, 10hrs/ wk
The cost is $529/ month or $898. Pay upfront for 2-months access.

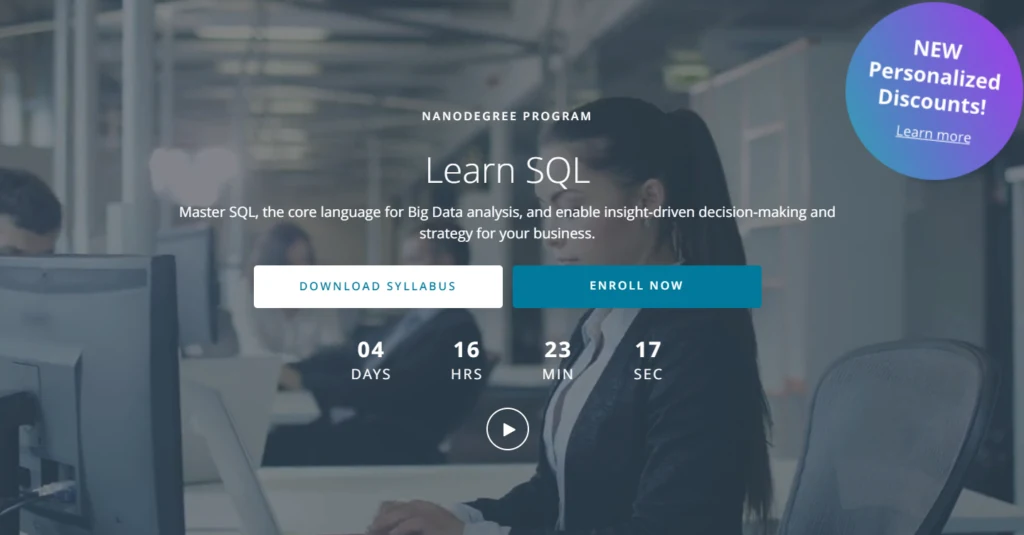
Udacity suggests that if you have basic computer skills, then you can write SQL and NoSQL language. To proceed, you should know and have comfort with Windows and MacOS Operating System, MS Word, Google Docs, PDF, PowerPoint, Keynote, Google Slides, Microsoft Excel, Google Spreadsheets. Plus basic understanding of data types (e.g., string, integer) and identify data-type held in a data table.
However, if you want to learn SQL in-depth, Udacity has a Nanodegree Program you can sign-up for
It is 2-months, 10hrs/ wk
The cost is $529/ month or $898. Pay upfront for 2-months access.
Data Analyst – Program Estimated time
It takes on average 4-months to complete this course with an invested 10-hours.
Data Analyst – Lessons to Expect
Introduction
Learn to wrangle, explore, analyze, and communicate data. Use NumPy and Pandas libraries in Python.
Projects include:
Weather Trends – download SQL data, analyze and compare trends to local and global temperature data
Investigate a dataset- use curated datasets, investigate data using NumPy and pandas, compose questions, and share findings
Practical Statistics – learn how to apply stats and probability to real-world situations, analyze A/B tests and build monitoring learning models, and analyze results
Data Wrangling – learn how to gather, assess, and clean data for analysis.
Data Visualization with Python – Learn the principles of visualization and provide insights and explanations for findings.
Data Analyst – Courses and Lessons

Udacity equips all students with a syllabus that can be downloaded and reviewed for each available course. The syllabus gives a more in-depth overview of the program breakdown into courses and lessons. Here is a breakdown of each course and each lesson:
Course 1- Introduction to Data Analysis
This course includes 6 lessons and 2 projects…
You will learn to use libraries in Python, to wrangle, explore, analyze, and communicate data. Investigate a Dataset- Using NumPy and pandas you will complete the entire data analysis by posing a question and then sharing answers and results.
- Lesson One- Learning Anaconda
- Lesson Two- Jupyter Notebooks
- Lesson Three- Data Analysis Process
- Lesson Four- Pandas and NumPy
- Lesson Five- Pandas and NumPy
- Lesson Six- Programming Workflow for Data Analysis
Course 2: Practical Statistics
Course Includes 13 lessons…
You will learn to apply inferential stats and probability to real-world scenarios. Analyze A/B tests and build learning models.
- Lesson One- Simpson’s Paradox
- Lesson Two- Probability
- Lesson Three-Binomial Distribution
- Lesson Four- Conditional Probability
- Lesson Five- Bayes Rule
- Lesson Six- Standardizing
- Lesson Seven- Sampling Distributions and Central Limit Theorem
- Lesson Eight- Confidence Intervals
- Lesson Nine- Hypothesis Testing
- Lesson Ten- T-Tests and A/B Tests
- Lesson Eleven- Regression
- Lesson Twelve- Multiple Linear Regression
- Lesson Thirteen- Logistic Regression
Course 3: Data Wrangling
Includes 4 lessons…
You will learn the data wrangling process: gather, assess, clean, wrangle programmatically, and prep for analysis.
- Lesson One- Intro to Data Wrangling
- Lesson Two- Gathering Data
- Lesson Three- Assessing Data
- Lesson Four- Cleaning Data
Course 4: Data Visualization with Python
Includes 7 lessons and 1 project…
You will learn to apply visualization principles, explore data visually, find insights and communicate results.
- Lesson One- Data Visualization in Data Analysis
- Lesson Two- Design of Visualizations
- Lesson Three- Univariate Exploration of Data
- Lesson Four- Bivariate Exploration of Data
- Lesson Five- Multivariate Exploration of Data
- Lesson Six- Explanatory Visualization
- Lesson Seven- Visualization Case Study
Trainers and In Collaboration with Kaggle

Josh Bernhard- Data Scientist at Nerd Wallet
Josh shares his passion for data for nearly a decade at all levels of the university, and as Lead Data Science Instructor at Galvanize.
Sebastian Thorin -Instructor
Founder and president of Udacity. Founder of Google X, where he led projects including the Self-Driving Car, Google Glass, and more.
Derek Steer- CEO at Mode
Derek is the CEO of Mode Analytics. He developed an analytical foundation at Facebook and Yammer and is authored SQL School and is a mentor at Insight Data Science.
Juno Lee- Curriculum Lead at Udacity
Juno is the curriculum lead for the School of Data Science. As a data scientist, she built recommendation engines, computer vision and NLP models, and tools to analyze user behavior.
Mike Yo- Data Analyst Instructor
Mike is a content developer with a multidisciplinary academic background, including math, statistics, physics, and psychology.
David Venturi- Data Analyst Instructor
Formerly a chemical engineer and data analyst, David created a personalized data science master’s program using online resources.
Sam Nelson- Product Lead
Sam is the Product Lead for Udacity’s Data Analyst, Business Analyst, and Data Foundation programs.
Data Analyst Pricing Options
Price Package Option 1:
Monthly Access – pay as you go
$529/ month
Price Package Option 2:
Pay upfront and save 15%
Both options you can learn at your own pace and cancel anytime.
All Udacity Programs include…

Real-world projects
Projects created by industry experts will help students master tech skills that businesses need
Mentor support
1,400 Technical mentors are on staff to help guide students forward by answering questions, motivating and helping students stay on track
Experience Project Reviewers
Personalized Services is provided to students to get project review feedback. Turnaround time is on average 1.1 hours. You can submit as many projects as you want for feedback and will receive practical tips and suggestions for improvements.
Career services
Students are given free resows to improve resumes, cover letters, improve the interview ores, and more.
Flexible learning program
All lessons fit your busy life. Students can learn at their own pace.
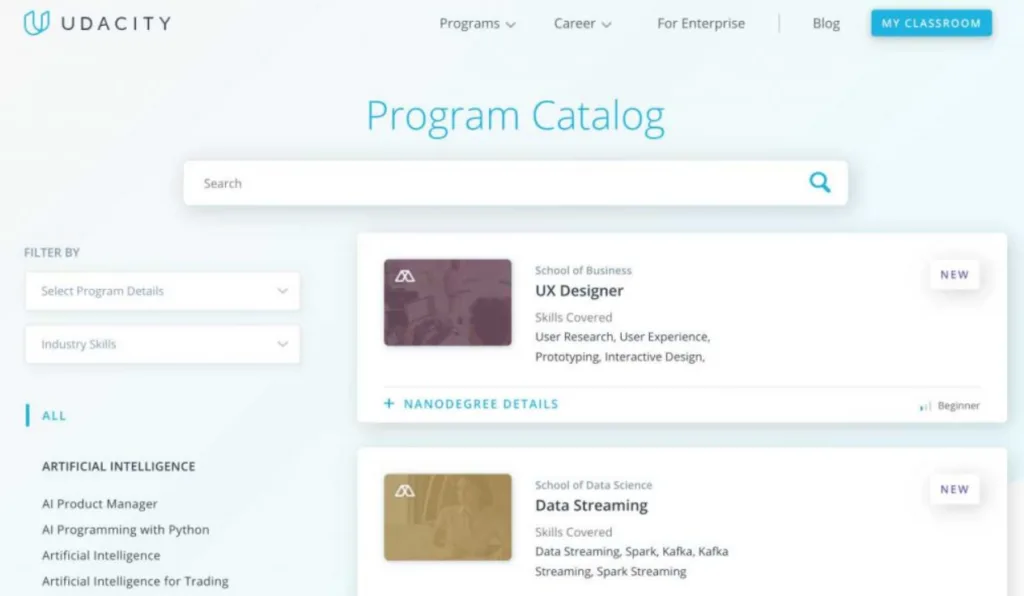
Data Analyst – Related Programs
1. Programming for Data Science with Python – Nanodegree Program – for beginners
Learn the fundamental programming tools: Python, SQL, the Terminal, and Git
2. Business Analytics – Nanodegree Program – for beginners
Learn data skills with SQL, Excel, and Tableau
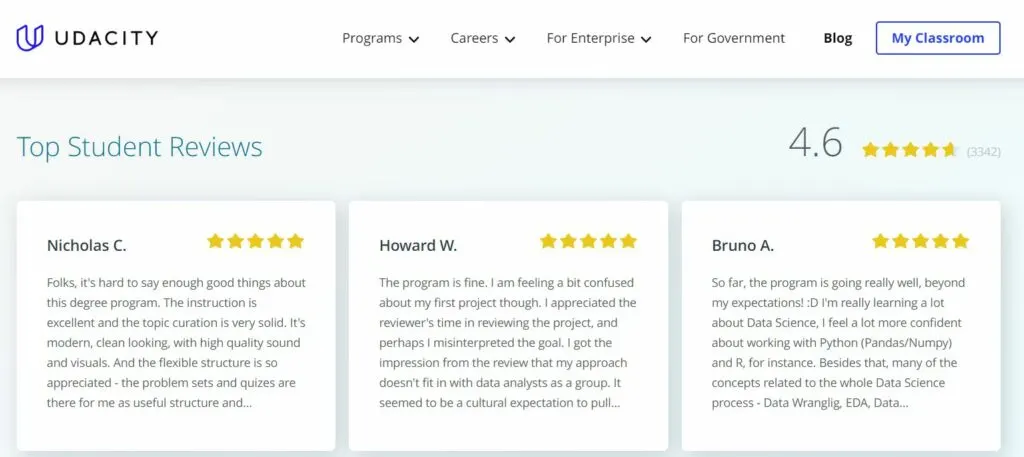
Data Analyst: Student Reviews

Alternate Data Analytics Online Courses
DataCamp – Data Analyst with Python
– learn how to import, clean, manipulate, and visualize data skills
Data Science Dojo- Data Science
– learn data science, data analytics, and machine learning with AI skills
Ironhack- Data Analytics Bootcamp
– learn Python, SQL, Tableau, and stats
Le Wagon– Data Science
– learn Python, SQL, mathematical concepts, visualization, and more
General Assembly – Data Analytics Course
– harness excel, SQL, and Tableau to analyze insights
FAQ
Question: What is a Nanodegree?
Answer: A Nanodegree is an online educational certificate only received online. It is an in-depth program that helps students develop technical skills related to computer science.
Question: What jobs will this program prepare me for?
Answer: Data Analyst, Data Analytics Consultant, Product Manager, and Management Consultant.
Question: How do I know if this program is right for me?
Answer: If you enjoy and find data analysis interesting, like to inspect data, and find solutions to problems, then this will be interesting to you.
Question: I have graduated from the Data Analyst program and I want to keep learning. Where should I go from here?
Answer: You can look at the Data Scientist Nanodegree program where you build skills in machine learning and neural networks.
Question: What software and versions will I need in this program?
Answer: You will need access to the Internet, and a 64-bit computer. Also, software such as Python and its common libraries (NumPy and Pandas).
Note: when the course begins, students on how to download these
Conclusion
I feel the Data Analytics Nanodegree Program is a great degree to get for people who like analyzing data and problem solving underlying issues that may not be easy to discover without the skills required. Depending on what knowledge you have will mean whether you can start with this program right away or have to take courses in Python and SQL first. If you know Python and SQL, then you can jump into the Data Analytics Program right away.
By accomplishing this course, you can add this achievement to your resume. It in turn opens the door for future career opportunities and possibly an increase in pay in a Data Analytical career. Being able to read and identify insightful data, answer questions, and provide results and solutions to a company can increase your value to that business.
My thoughts on the timing though… when signing up for the course, they recommend 10-hours a week with an estimated completion of 4-months. I suggest you plan your time wisely because you either pay as you go, which is over $500 a month, or a lump sum of over 4-months.
Therefore, the longer you take to complete the courses, the more it may cost you in the end. If you don’t spend your time wisely, then you may go over 4-months and that could cost you another $500 a month before you complete the course. So even though it is an advantage to work at your own pace, it doesn’t mean you can milk the time. You will need to remain vigilant with your studies and be sure that you can keep track of your time so that you complete the course within the expected 4-months.